Graphs
TL;DR
Nutree implements conversion to DOT
and Mermaid formats.
This allows to visualize trees as graphs in various formats like png, svg, etc.
The TypedTree class introduces the concept of
typed nodes, which allows to generate labelled edges in the graph representation.
Note
Tree (and TypedTree even
more so) has features that make mapping to a graph easy.
However it still is a tree at heart.
If you are looking for a data model with full graph support, links between
arbitrary nodes, advanced navigation methods, or SPARQL queries,have a look
at specialized libraries, such as rdflib .
In graph theory, Tree is a
Rooted Tree
which is a subform of a
Directed Graph
(aka digraph).
Accordingly every tree can be visualized in a graph diagram:
Every tree node becomes a graph node
Exception: tree nodes with identical data (aka ‘clones’) map to one single graph node.Parent- and child nodes are connected by an arrow (aka ‘edge’) pointing from parent to child, meaning ‘is child of’.
While every tree is a digraph, not every digraph can be directly represented as tree, because arbitrary directed graphs
may contain closed circles (i.e. the graph is not ‘acyclic’)
may have loops (arrows that directly connect nodes to themselves), which is a special case of 1.)
may have multiple arrows with same source and target nodes
may not have an obvious root node (i.e. the graph is not ‘rooted’)
may have nodes that are the target of more than one arrow
may have other edge semantics than ‘is child of’
As a consequence
Graphs with circles would result in trees of infinite depth. We stop adding a child node if it already appears as its own ancestor.
See 1.): we do not allow to add a tree node as child of itself.
We do not allow to add the same tree node a second time under one parent.
We pick the first tree node, or search for a good candidate using heuristics.
A graph node that is target of multiple arrows is added to the tree multiple times. Each of thoses tree nodes (‘clones’) reference the identical data object.
The
TypedTreeclass handles this. See below for details.
Writing Digraphs
DOT Format
Nutree implements conversion to DOT format. Given this tree
Tree<'Root'>
├── 'A'
│   ├── 'a1'
│   │   ├── 'a11'
│   │   ╰── 'a12'
│   ╰── 'a2'
╰── 'B'
    ╰── 'b1'
        ├── 'a11'  <- second occurrence
        ╰── 'b11'
we can write a DOT formatted file like so:
tree.to_dotfile("graph.gv")
digraph Root {
    // Node definitions
    __root__ [label="Root" shape="box"]
    -2117698517398243110 [label="A"]
    8696834500465194416 [label="a1"]
    3848329043807418154 [label="a11"]
    -8723831530700312132 [label="a12"]
    -1180776893324476219 [label="a2"]
    8369695036033697218 [label="B"]
    1739272887205481547 [label="b1"]
    -1397849070657872512 [label="b11"]

    // Edge definitions
    __root__ -> -2117698517398243110
    -2117698517398243110 -> 8696834500465194416
    8696834500465194416 -> 3848329043807418154
    8696834500465194416 -> -8723831530700312132
    -2117698517398243110 -> -1180776893324476219
    __root__ -> 8369695036033697218
    8369695036033697218 -> 1739272887205481547
    1739272887205481547 -> 3848329043807418154
    1739272887205481547 -> -1397849070657872512
}
This DOT graph may be rendered in different formats like so:
tree.to_dotfile("tree_graph.png", format="png")

Note that in the previous image, the clone tree node “a11” is represented
as a single graph node.
Separate nodes can be created by passing the unique_nodes=False argument:
tree.to_dotfile("graph.png", format="png", unique_nodes=False)

Pass the add_root=False argument to remove the root node:
tree.to_dotfile("graph.png", format="png", add_root=False)

The DOT output can be customized with default attribute definitions by passing
the graph_attrs, node_attrs, and edge_attrs arguments.
In addition, the default attributes can be overriden per node and edge by passing
mapper callbacks.
See also list of available attributes.
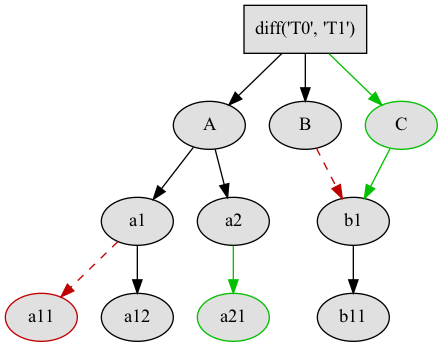
Let’s visualize the result of the Diff and Merge example:
tree_2 = tree_0.diff(tree_1)

def node_mapper(node: Node, attr_def: dict):
    dc = node.get_meta("dc")
    if dc == DiffClassification.ADDED:
        attr_def["color"] = "#00c000"
    elif dc == DiffClassification.REMOVED:
        attr_def["color"] = "#c00000"

def edge_mapper(node: Node, attr_def: dict):
    dc = node.get_meta("dc")
    if dc in (DiffClassification.ADDED, DiffClassification.MOVED_HERE):
        attr_def["color"] = "#00C000"
    elif dc in (DiffClassification.REMOVED, DiffClassification.MOVED_TO):
        attr_def["style"] = "dashed"
        attr_def["color"] = "#C00000"

tree_2.to_dotfile(
    "result.png",
    format="png",
    graph_attrs={},
    node_attrs={"style": "filled", "fillcolor": "#e0e0e0"},
    edge_attrs={},
    node_mapper=node_mapper,
    edge_mapper=edge_mapper,
)
Mermaid Format
Mermaid is a diagramming and charting tool that uses
Markdown -inspired text for defining diagrams.
It is a popular choice for documentation and is supported by many Markdown
editors.
Nutree implements conversion to
Mermaid flowchart format.
Given this tree
Tree<'Root'>
├── 'A'
│   ├── 'a1'
│   │   ├── 'a11'
│   │   ╰── 'a12'
│   ╰── 'a2'
╰── 'B'
    ╰── 'b1'
        ├── 'a11'  <- second occurrence
        ╰── 'b11'
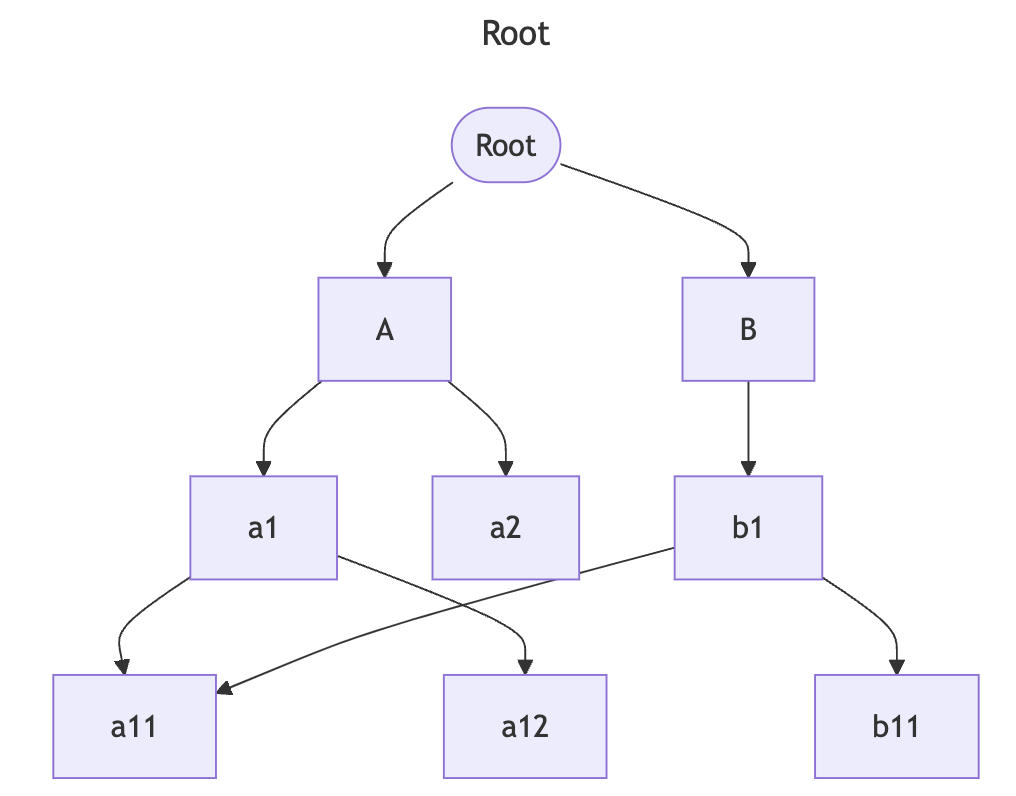
we can write a Markdown file with embedded Mermaid flowchart like so:
tree.to_mermaid_flowchart("graph.md")
```mermaid
---
title: Root
---

%% Generator: https://github.com/mar10/nutree/

flowchart TD

%% Nodes:
0(["Root"])
1["A"]
2["a1"]
3["a11"]
4["a12"]
5["a2"]
6["B"]
7["b1"]
8["b11"]

%% Edges:
0 --> 1
1 --> 2
2 --> 3
2 --> 4
1 --> 5
0 --> 6
6 --> 7
7 --> 3
7 --> 8
```
A preview application would render a graph from this markdown definition.
However we can also create a rendered image file instead:
tree.to_mermaid_flowchart("graph.png", format="png")
This graph may be rendered in different formats like so (using a TypedTree example here):
tree.to_mermaid_flowchart(
    "/path/to/tree_1.svg",
    title="Typed Tree",
    direction="LR",
    format="svg",
    mmdc_options={"--theme": "forest"},
)
Note
Writing of plain Markdown format is natively implemented by nutree.
Rendering output formats like png, svg, or pdf requires the
installation of the Node.js based command-line interface (CLI) mmdc.
See mermaid.cli for details.
Typed Tree
The TypedTree class is a variant derived from
Tree that introduces the concept of typed nodes.
It adds a new node.kind attribute and modifies some methods to access
children by that type.
In a nutshell: TypedTree nodes can have multiple types of children.
Main differences to plain Tree:
Uses
TypedNodethat adds an additionalnode.kindattribute.The node’s kind becomes part of the display name by default:
repr="{node.kind} → {node.data}", e.g. ‘friend → Alice’.Node methods like
get_children()get an additional mandatory argumentkindto filter by type.
Passkind=ANY_KINDto retrieve all children.Node methods like
get_index()andfirst_sibling()assume ‘… of the same type’.
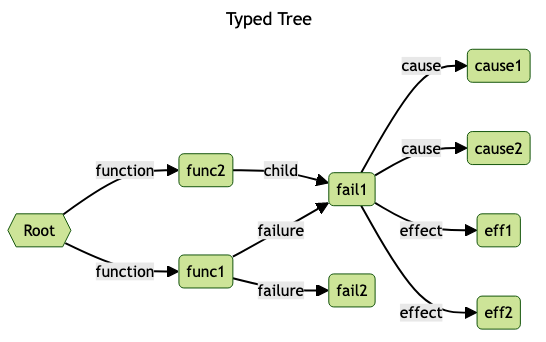
An additional argumentany_kind=Truecan be passed to ignore the types.When converting to a graph,
node.kindbecomes the label of the arrow pointing from the parent to this node.
Note
Methods like iter() still access all
nodes, ignoring the types.
When adding nodes, we now pass this type, e.g.:
tree = TypedTree("Pencil")

func = tree.add("Write on paper", kind="function")
fail = func.add("Wood shaft breaks", kind="failure")
fail.add("Unable to write", kind="effect")
fail.add("Injury from splinter", kind="effect")
fail.add("Wood too soft", kind="cause")

fail = func.add("Lead breaks", kind="failure")
fail.add("Cannot erase (dissatisfaction)", kind="effect")
fail.add("Lead material too brittle", kind="cause")

func = tree.add("Erase text", kind="function")
...
tree.print()
TypedTree<'Pencil'>
├── function → Write on paper
│   ├── failure → Wood shaft breaks
│   │   ├── effect → Unable to write
│   │   ├── effect → Injury from splinter
│   │   ╰── cause → Wood too soft
│   ╰── failure → Lead breaks
│       ├── effect → Cannot erase (dissatisfaction)
│       ╰── cause → Lead material too brittle
╰── function → Erase text
The benefit becomes evident when we map a tree to a graph representation. It is now possible to generate labelled edges:
tree.to_dotfile(
    "/path/tree.png",
    format="png",
    graph_attrs={"rankdir": "LR"},
)

Navigation methods are type-aware now:
eff1 = tree["Unable to write"]
eff2 = tree["Injury from splinter"]
cause1 = tree["Wood too soft"]

assert eff1.first_sibling() is eff1
assert eff1.last_sibling() is eff2
assert eff1.last_sibling(any_kind=True) is cause1

assert cause1.get_index() == 0
assert cause1.get_index(any_kind=True) == 2

assert len(list(tree.iterator(kind="effect"))) == 3
Keep in mind that a tree node is unique within a tree, but may reference identical
data objects, so these clones could exist at different locations of tree.
The resulting graph node only exists once.
TypedTree’s node type only affects
parent → child relations. Arbitrary links are not supported.
If you are looking for a data model with full graph support have a look
at specialized libraries,such as rdflib.
RDF Format
Nutree implements conversion to RDF format. Given this tree
TypedTree<'Pencil'>
├── function → Write on paper
│   ├── failure → Wood shaft breaks
│   │   ├── effect → Unable to write
│   │   ├── effect → Injury from splinter
│   │   ╰── cause → Wood too soft
│   ╰── failure → Lead breaks
│       ├── effect → Cannot erase (dissatisfaction)
│       ╰── cause → Lead material too brittle
╰── function → Erase text
We can convert this directly to an rdflib.Graph object:
g = tree.to_rdf_graph()
Use basic triple matching to find all child nodes of type ‘cause’:
# Note that Literal will be `None` if rdflib is not available
from nutree.rdf import NUTREE_NS, Literal

cause_kind = Literal("cause")
for s, p, o in g.triples((None, NUTREE_NS.kind, cause_kind)):
    name = g.value(s, NUTREE_NS.name)
    print(f"{name} is a {o}")
Wood too soft is a cause
Lead material too brittle is a cause
Execute a SPARQL query:
query = """
PREFIX nutree: <http://wwwendt.de/namespace/nutree/rdf/0.1/>

SELECT ?data_id ?kind ?name
WHERE {
    BIND("cause" as ?kind)

    ?data_id nutree:kind ?kind ;
        nutree:name ?name .
}
"""

qres = g.query(query)
for row in qres:
    print(f"{row.data_id} {row.name} is a {row.kind}")
-858093319983296182 Wood too soft is a cause
-3061307893397568517 Lead material too brittle is a cause
This would be the ‘turtle’ formatted serialization:
g.serialize()
@prefix nutree: <http://wwwendt.de/namespace/nutree/rdf/0.1/> .
@prefix xsd: <http://www.w3.org/2001/XMLSchema#> .

nutree:system_root nutree:has_child -6893421218868685274,
        3432943543584592100 ;
    nutree:name "Pencil" .

-6935157396369479208 nutree:has_child -3061307893397568517,
        -2033919816722635981 ;
    nutree:index 1 ;
    nutree:kind "failure" ;
    nutree:name "Lead breaks" .

-6893421218868685274 nutree:has_child -6935157396369479208,
        4885824412641056401 ;
    nutree:index 0 ;
    nutree:kind "function" ;
    nutree:name "Write on paper" .

-3680688296053900211 nutree:index 1 ;
    nutree:kind "effect" ;
    nutree:name "Injury from splinter" .

...
Note
Converting to RDF requires an installation of rdflib
Either install them separately or install nutree with extras:
pip install "nutree[graph]" or pip install "nutree[all]".